What is Analytical Hierarchy Process (AHP) ?
Analytical Hierarchy Process (AHP) is a mathematical tool of problem
solving that has become popular amongst management personnel in the late 1990’s
and early 2000’s. The AHP method has been created after understanding the
structure of a problem and the real hindrance that managers face while solving
it. This structure has been explained in this article.
The Logic behind AHP
The AHP method looks at the problem in three parts. The first part is
the issue that needs to be resolved, the second part are the alternate
solutions that are available to solve the problem. The third and the most
important part as far as the AHP method is concerned is the criteria used to
evaluate the alternative solutions.
The AHP method understands that although there are several criteria, the
magnitude of each criterion may not be equal. For instance if you have to
choose between two restaurants, the taste and the waiting time are two factors,
however both of them may not have equal importance in your perception. The
taste may ne far more important than the waiting time and so on. Therefore if
you assign weightage of 2 to taste and 1 to waiting time, you are more likely
to arrive at a restaurant that will best meet your need.
Hence, while evaluating alternative solutions, weights need to be
attached to the criteria to ensure reaching the correct conclusion. This may
seem obvious. However, until very late management scientists have been facing
issues as to how to assign weights. In the above example, our assignment of
weights was arbitrary. Also the example had only two criteria. As the number of
criteria (factors) multiplies, the assignments become more and more arbitrary.
The AHP method has inbuilt checks and balances. These checks and
balances, therefore ensure that you reach logically consistent solutions when
you compare the relative importance of the criteria in the process of assigning
weights to them.
It is for this reason that AHP is one of the most sought after
technicques in management science today. Managers in mega corporations like
General Electric, Ford Motors, Motorola etc, use it in their six sigma
projects.
The Connection Between AHP and Six Sigma
AHP is a separate technique. It is not a part of the standard Six Sigma
methodology. In fact, it was developed many years after the Six Sigma
methodology was developed. However it has found large scale application in six
sigma projects. Managers use AHP to assign numerical weights to factors. These
factors could be the ones used by the customers while evaluating a product or
they could be the ones used by the management to evaluate alternative solutions.
Drawbacks of AHP
The AHP method has its own issues. The method involves higher level
mathematics. It is based on the concept of eigen vectors. It is for this reason
that performing the calculations pertaining to AHP on an Excel sheet are an
ordeal. However, of late software tools have been developed that can perform
the calculations. The managers therefore just need to be aware of the AHP
process, the calculations are automated.
How to Use the Analytical Hierarchy Process (AHP)
Although the AHP is one of the most advanced methods available in the
field of management science and operations research, the complexity involved in
using this tool makes it difficult to apply. Thankfully software tools have
been built which automate the mathematics intensive part. The user has to
follow a simple methodology of data collection which is then fed into the tool
to get the results.
Here is the procedure for doing the same:
Step 1: Define Alternatives
The AHP process begins by defining the alternatives that need to be
evaluated. These alternatives could be the different criteria that solutions
must be evaluated against. They could also be the different features of a
product that need to be weighted to better understand the customers perception.
At the end of step 1, a comprehensive list of all the available alternatives
must be ready.
Step 2: Define the Problem and Criteria
The next step is to model the problem. According to AHP methodology, a
problem is a related set of sub problems. The AHP method therefore relies on
breaking the problem into a hierarchy of smaller problems. In the process of
breaking down the sub-problem, criteria to evaluate the solutions emerge.
However, like root cause analysis, a person can go on and on to deeper levels
within the problem. When to stop breaking the problem into smaller sub problems
is a subjective judgement.
Example: A firm needs to decide on the best investment option amongst
stocks, bonds, real estate and gold. If the AHP method is used, the problem of
best investment will be broken down into smaller problems like protection from
downfall, maximum chance of appreciation, liquidity in the market and so on.
Each of these sub problems can then be broken into smaller problems till the
management feels that the appropriate criteria has been reached.
Step 3: Establish Priority amongst Criteria Using
Pairwise Comparison
The AHP method uses pairwise comparison to create a matrix. For example
the firm will be asked to weigh the relative importance of protection from
downfall vs. liquidity. Then in the next matrix, there will be a pairwise
comparison between liquidity and chance of appreciation and so on. The managers
will be expected to fill this data as per the expectations of the end consumer
or the people who are going to use the process.
Step 4: Check Consistency
This step is inbuilt in most software tools that help solve AHP
problems. For instance if I say that liquidity is twice as important as
protection from downfall and in the next matrix I say that protection from
downfall is half as important as chance of appreciation, then the following
situation emerges:
Liquidity = 2 (Protection from downfall)
Protection from downfall = ½ (Chance of appreciation)
Therefore, Liquidity must equal chance of appreciation.
However, if in the pairwise comparison of liquidity and chance of
appreciation, if I have given a weight of more or less than 1, then my data is
inconsistent. Inconsistent data gives inconsistent results, hence prevention is
better than cure.
Step 5: Get the Relative Weights
The software tool will run the mathematical calculation based on the
data and assign relative weights to the criteria. Once the equation is ready
with weighted criteria, one can evaluate the alternatives to get the best
solution that matches their needs.
EXAMPLE OF HOW IT WORKS
We've mentioned how AHP is unique because it can
quantify criteria and alternatives, but what does that really look like? As an
end user of Prioritization Helper, you won't see the calculations going on
behind the scenes. Here is a quick look of the calculations behind a result.
Let's pretend the Smith family wants to decide the
best city to live in - City A, B, C, or D. The goal is to determine which city
is best, given the criteria - Culture, Close to Family, Jobs, Housing, and
Transportation. They weigh the criteria, and compare the four city alternatives
to the criteria. The following tables illustrate the derived data based on
their input. In general, all of the decimals will add up to 1, and higher
decimals equals a higher priority.
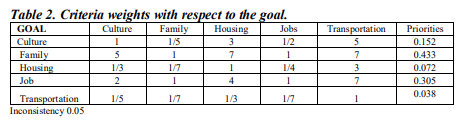
Table 2 shows how the criteria were rated against
each other. Looking at the top row, Culture scored a "3" above
Housing and a "5" above Transportation, while Family scored a
"5" above Culture, and Jobs scored a "2" above Culture.
This gives Culture 15.2% of the criteria priority, with the most important
criteria being Family, at 43.3%.
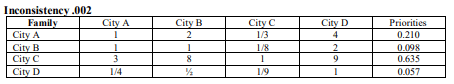
The next table demonstrates the weights of each
alternative against the criteria Family. Here, City C was the closest to
family, while City D was the furthest. This would be repeated for every
criteria.
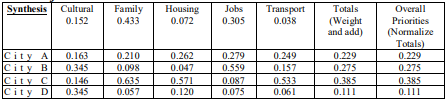
Finally, the weighed importance of each criteria is
then multiplied against the score of each alternative to get the weighed score
(For City A's weighted Cultural score: .152 x .163 = .024776). Add all new
criteria numbers together to get the Overall Priority score (For City A:
.024776 + .09093 + .018864 + .085095 + .009462 = .229)
Bahurmoz, Asma. "The
Analytic Hierarchy Process: A Methodology for Win-Win Management " JKAU:
Econ. & Adm., Vol. 20, No. 1, 2006.
The Smith's best decision based off of their
priorities, is City C. In Prioritization Helper, the final results would look
like "City C - 38.5% City B - 27.5% City A - 22.9% City D - 11.1%"
As you can see, there's a lot going on, and it can
be tricky to understand. That's why we've created Prioritization Helper! You
can gain the benefits of an unbiased decision in minutes, without the hard
work.
Informative content
ReplyDeleteInformative
ReplyDeleteKnowledgeable
ReplyDeleteI read this blog. your post so nice and very informative post.thanks for sharing this post
ReplyDeleteinformative content
ReplyDeleteMast likha hai
ReplyDeleteInformative
ReplyDeleteVery concise, crisp and informative!🙌
ReplyDeletevery informative content
ReplyDeleteAmazing blog
ReplyDeleteNice👍
ReplyDelete